suppressPackageStartupMessages(library(cmdstanr))
mod = cmdstan_model("cauchy.stan")
matrix = rbind(
c(0.1, 0),
c(-0.3, 0),
c(0, 0)
)
obs = c(0.2, 0.1, -0.4)
fit = mod$sample(
seed = 1,
output_dir = "stan_out",
data = list(design_matrix = matrix, observations = obs),
iter_sampling = 10000,
refresh = 0
)Challenge questions
TipNot for grades!
These are not essential for learning the material and can be skipped without affecting your grade. See syllabus for more information. I will not post solutions for the challenge questions.
Consider the following regression model:
cauchy.stan
data {
  matrix[3,2] design_matrix; // number of successes
  vector[3] observations;
}

parameters {
  vector[2] coefficients;
}

model {
  coefficients[1] ~ cauchy(0, 1);
  coefficients[2] ~ cauchy(0, 1);

  for (i in 1:3) {
    observations[i] ~ normal(design_matrix[i] * coefficients, 1);
  }
}
We now run it on a simple synthetic dataset (note the zeros in the design matrix):
…and look at the trace plots…
suppressPackageStartupMessages(library(bayesplot))
suppressPackageStartupMessages(library(ggplot2))
mcmc_trace(fit$draws(), pars = c("coefficients[1]", "coefficients[2]")) + theme_minimal()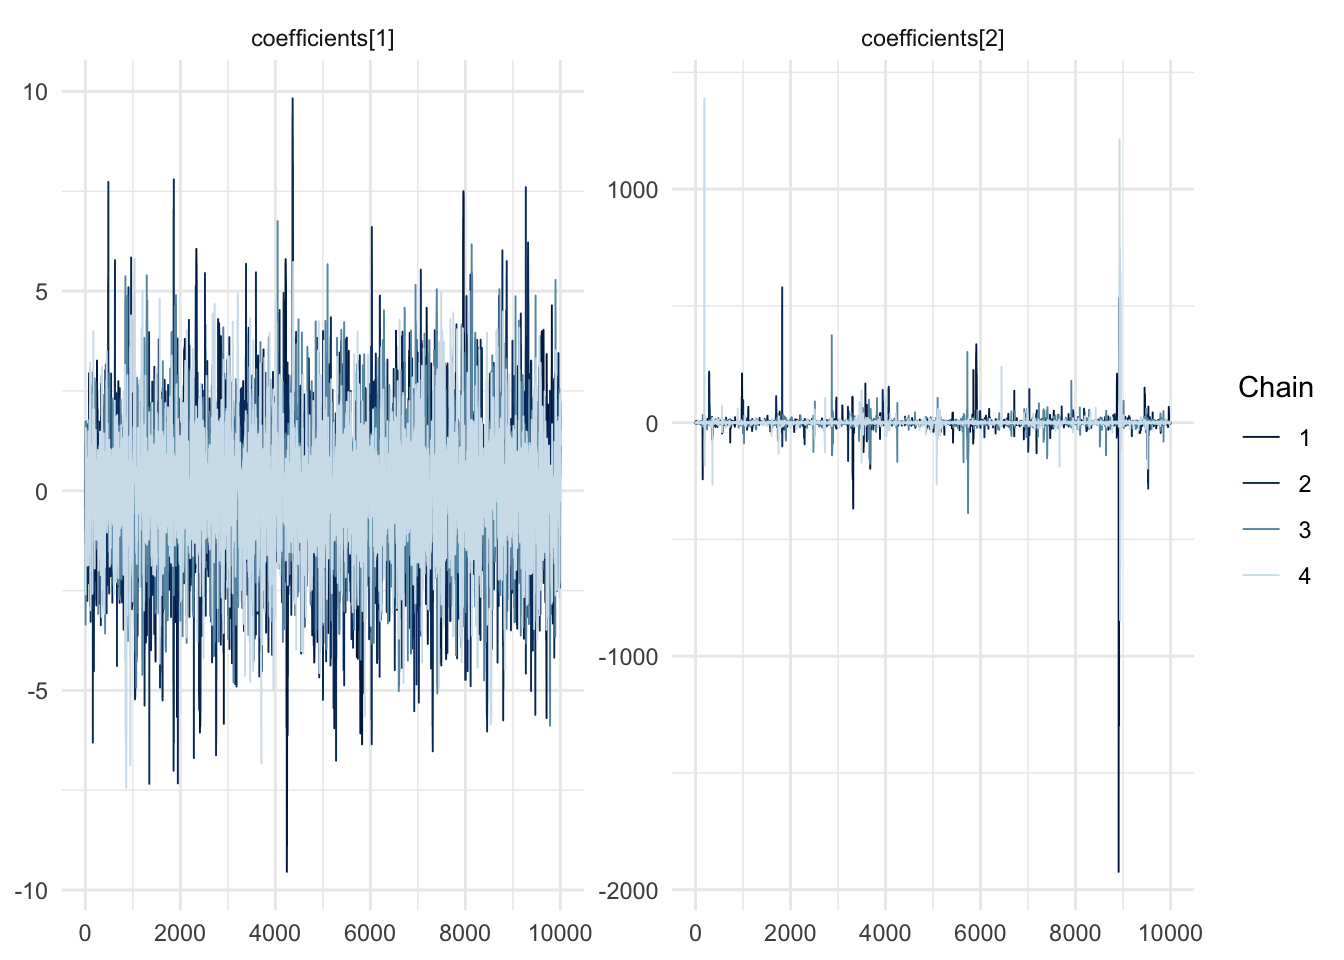
What is going on with the second coefficient? Would you get a different behaviour if you used i.i.d. samples?