Calibration
Outline
Topics
- Notion of calibration.
- Nominal versus actual coverage.
Rationale
Returning a credible region is helpful as it conveys how much certain or uncertain we are about our answer.
However, these estimates of uncertainty can be misleading if they are too confident or too hesitant. The notion of calibration formalizes this intuition.
Example
- Familiar in Vancouver: “Tomorrow: 90% chance of rain,”
- here, “90%” is an example of nominal coverage.
- Of those days where the forecast says “Tomorrow: 90% chance of rain”…
- what fraction of those days did it actually rain?
- That fraction is an example of actual coverage.
Definition: a measure of uncertainty is calibrated if its nominal coverage matches its actual coverage.
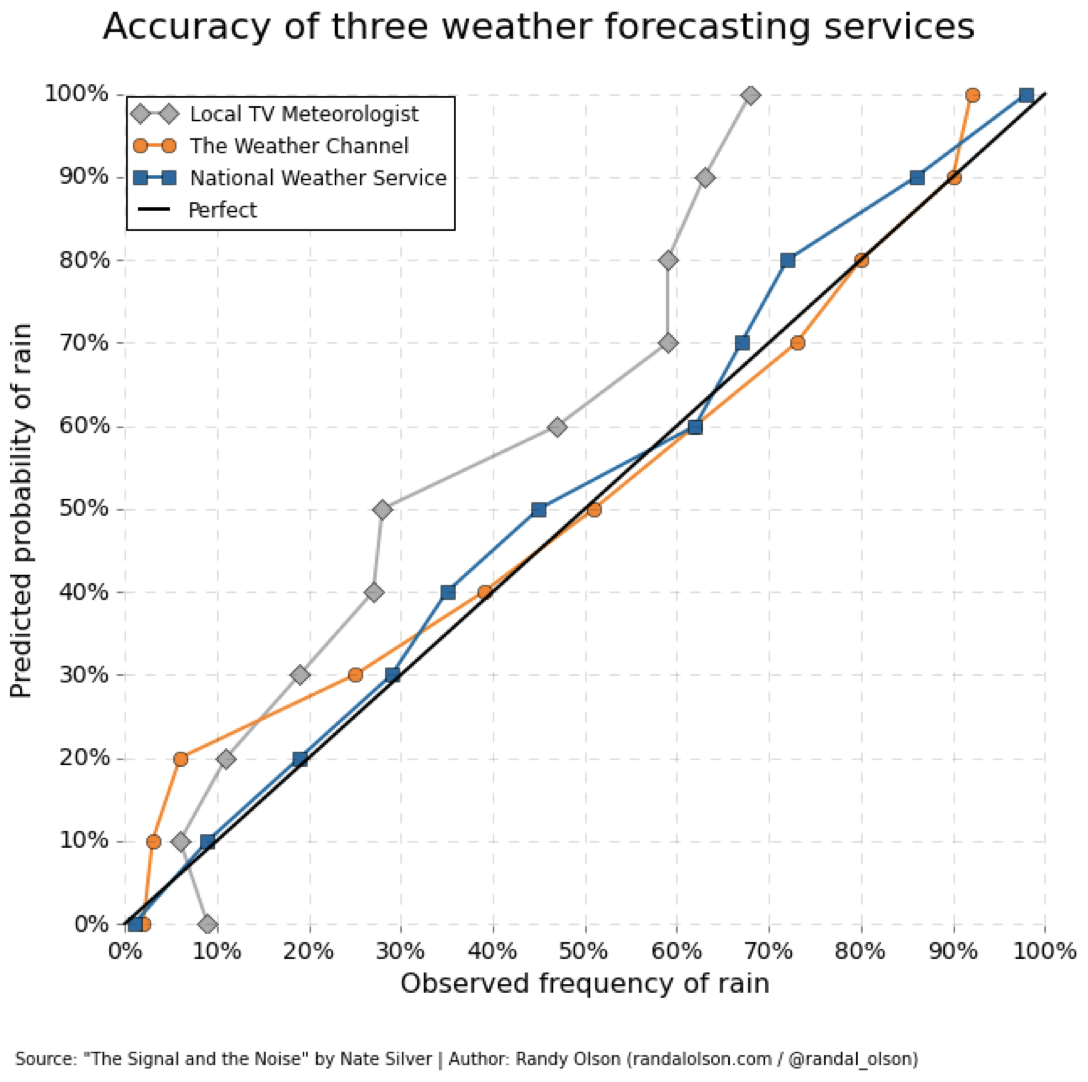
Question: which weather source(s), if any, provide reasonably calibrated rain uncertainty estimates?
- The local TV meteorologist.
- The Weather Channel.
- National Weather Channel.
- The Weather Channel and National Weather Channel.
- None of them.
The Weather Channel and National Weather Channel are markedly more calibrated than the local TV.
To see why, note that “nominal coverage matching the actual coverage” corresponds to “hugging” the black diagonal line (i.e. the function \(y = x\)).
The local TV is clearly “pessimistic” in its forecasts. For example, of the days it predicts “100% chance of rain”, rain occurs only about 70% of the time.
This is almost certainly a form of expectation manipulation, i.e. people are more happy when rain is predicted and it does not rain than the other way around.