Graphical models
Outline
Topics
- Directed graphical models.
Rationale
Graphical models help understand complex models such as hierarchical ones
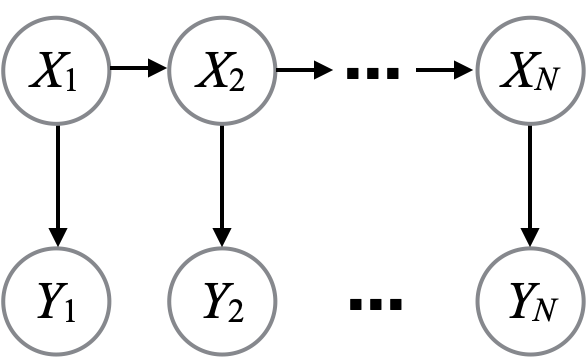
Directed graphical model
A graphical model is a discrete graph showing the dependencies involved in a forward sampling description of a model. Specifically:
Definition: a directed graphical model is a discrete graph such that:
- the set of vertices is a set of random variables,
- there is an edge \(X_1 \to X_2\) if the forward sampling step producing \(X_2\) requires knowing \(X_1\).
Examples
Exchangeable observations
Many simple models can be written as:
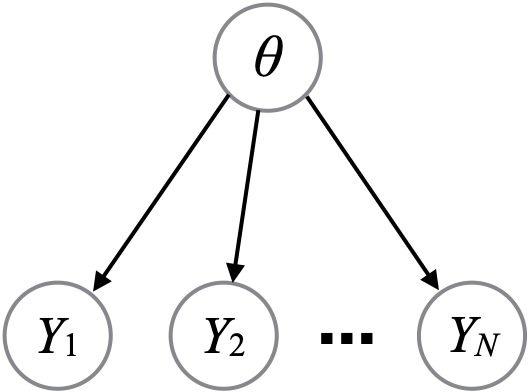
\[\begin{align*} \theta &\sim \text{SomePrior} \\ y_i | \theta &\sim \text{SomeLikelihood}(\theta). \end{align*}\]
Most of the models we have encountered so far have this form.
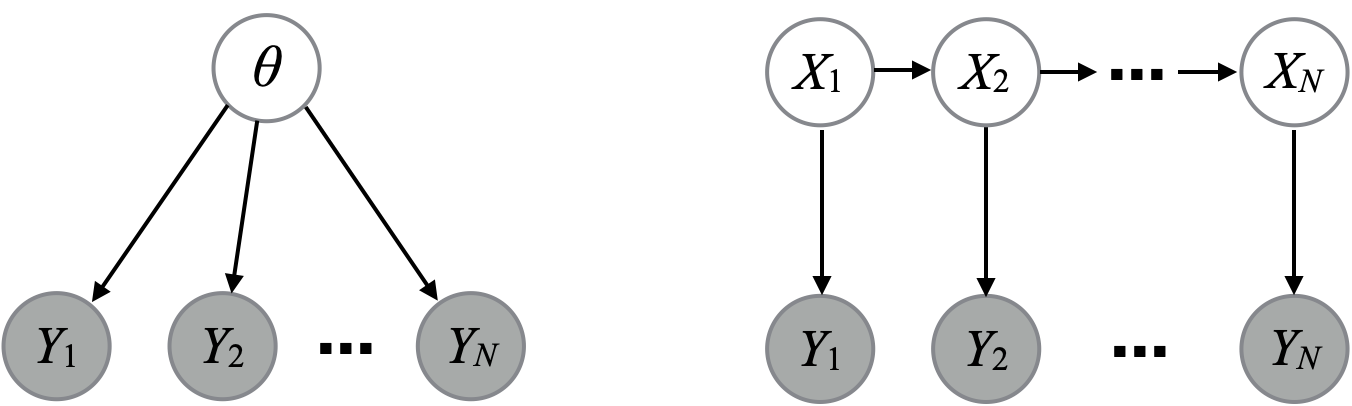
Conditioning
Shaded nodes in a directed graphical model indicate what we condition on (i.e. what we observe).
Plates
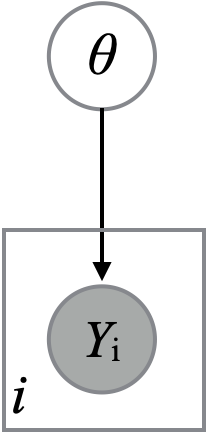
Plate: When there are too many vertices to draw in a graphical model, use a square (“plate”) to indicate a group of nodes that are repeated several times. In other words, a graphical “for loop.”
Further pointers on graphical models
Directed graphical models are also useful to identify conditional independence relationships (recall, \(A\) is conditionally independent of \(B\) given \(C\) if \(\Pr(A|C) \Pr(B|C) = \Pr(A \cap B | C)\)).
If you are curious, watch this video to see how this is done, or read the original paper.